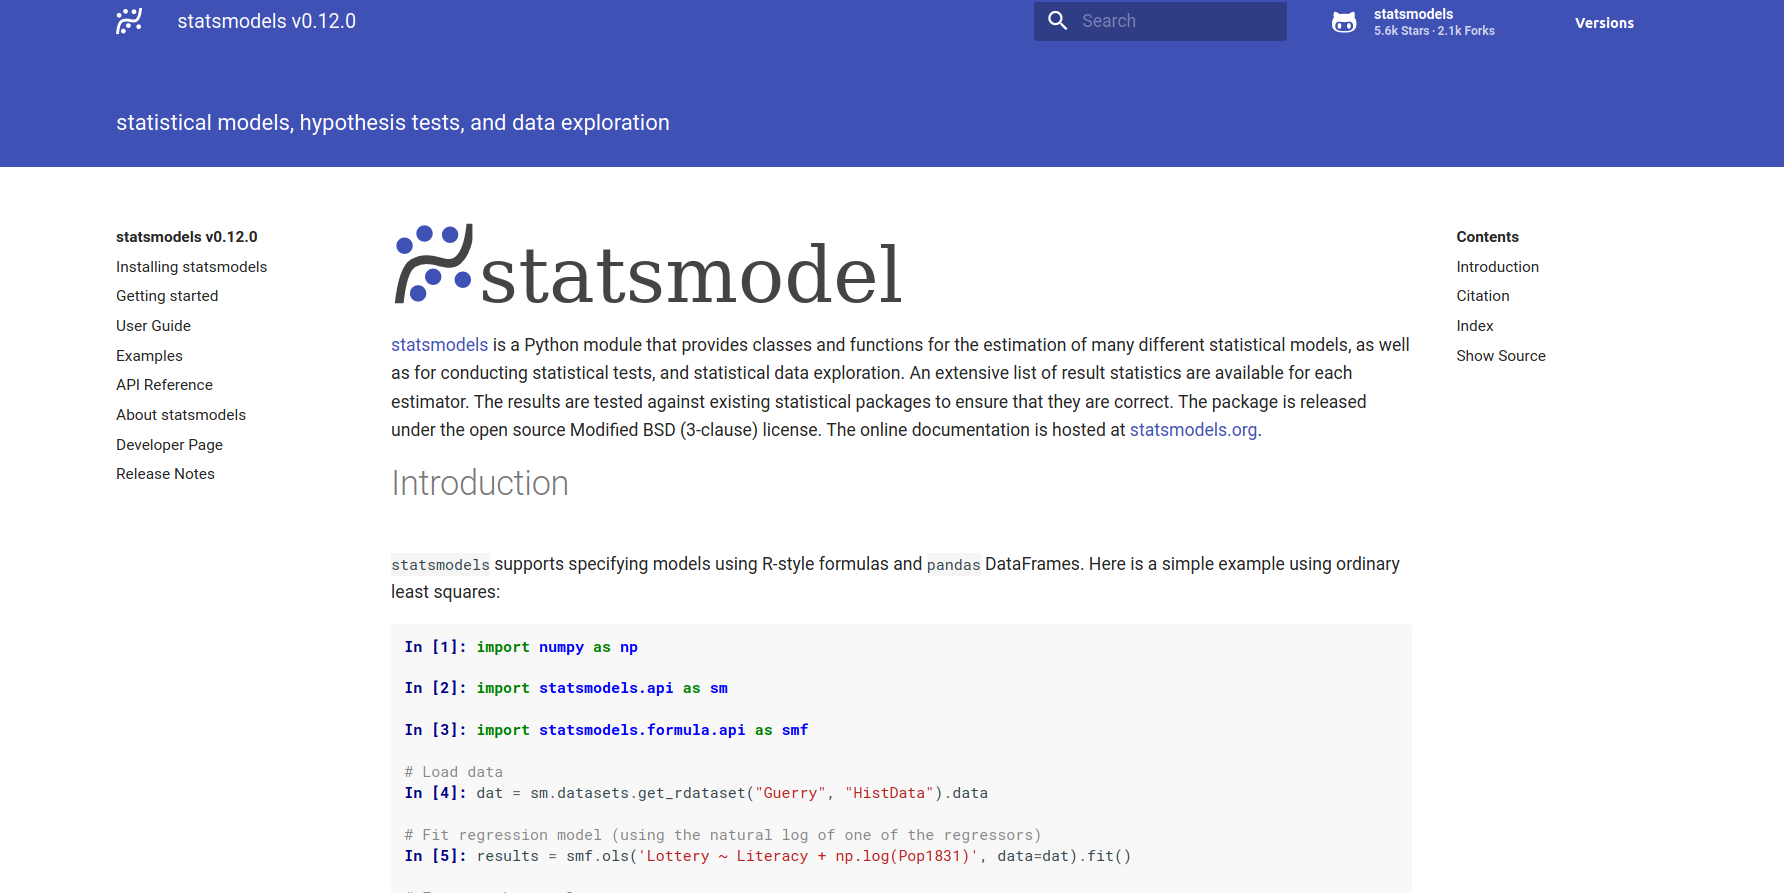
statsmodels
Have you ever needed to run some flavor of linear regression, time series analysis, mixed model, or some other kind of analysis? This week we share a popular library that you may not know about, statsmodels/statsmodels, that provides an impressive list of features to make statistical computations (descriptive statistics and estimation and inference for statistical models) easy for you.

We encourage you to contribute to the research software encyclopedia and annotate the respository:
otherwise, keep reading!
- What is statsmodels?
- How do I cite it?
- How do I contribute to the software survey
- Where can I learn more?
What is Statsmodels?
You might be familiar with scipy, a standard go-to Python library for general mathematics, science, and engineering. For example, you might use it to do a simple linear regression, providing parameters x and y, and calculating a regression line. Scipy seems to give back a slope, intercept, r-value, p-value, and standard error:
from scipy import stats
import numpy as np
x = np.random.random(10)
y = np.random.random(10)
slope, intercept, r_value, p_value, std_err = stats.linregress(x,y)

# To get coefficient of determination (r_squared)
print("r-squared:", r_value**2)
r-squared: 0.15286643777
If you’ve ever used R, statsmodels (at least to me) feels a little more like model generation in R. We might calculate a comparable linear regression, but then want to get a more robust summary table.
# Load modules and data
import numpy as np
import statsmodels.api as sm
spector_data = sm.datasets.spector.load(as_pandas=False)
spector_data.exog = sm.add_constant(spector_data.exog, prepend=False)

# Fit and summarize OLS model
mod = sm.OLS(spector_data.endog, spector_data.exog)
res = mod.fit()
print(res.summary())
                            OLS Regression Results
==============================================================================
Dep. Variable:                      y   R-squared:                       0.416
Model:                            OLS   Adj. R-squared:                  0.353
Method:                 Least Squares   F-statistic:                     6.646
Date:                Thu, 27 Aug 2020   Prob (F-statistic):            0.00157
Time:                        16:04:46   Log-Likelihood:                -12.978
No. Observations:                  32   AIC:                             33.96
Df Residuals:                      28   BIC:                             39.82
Df Model:                           3
Covariance Type:            nonrobust
==============================================================================
                 coef    std err          t      P>|t|      [0.025      0.975]
------------------------------------------------------------------------------
x1             0.4639      0.162      2.864      0.008       0.132       0.796
x2             0.0105      0.019      0.539      0.594      -0.029       0.050
x3             0.3786      0.139      2.720      0.011       0.093       0.664
const         -1.4980      0.524     -2.859      0.008      -2.571      -0.425
==============================================================================
Omnibus:                        0.176   Durbin-Watson:                   2.346
Prob(Omnibus):                  0.916   Jarque-Bera (JB):                0.167
Skew:                           0.141   Prob(JB):                        0.920
Kurtosis:                       2.786   Cond. No.                         176.
==============================================================================

Notes:
[1] Standard Errors assume that the covariance matrix of the errors is correctly specified.
You can quickly see that there is quite a bit more information that is quickly shown.
Why is it useful?
If we read the About page, we learn some interesting things!
The models module of scipy.stats was originally written by Jonathan Taylor. For some time it was part of scipy but was later removed. During the Google Summer of Code 2009, statsmodels was corrected, tested, improved and released as a new package. Since then, the statsmodels development team has continued to add new models, plotting tools, and statistical methods.
That’s so neat! It goes to show that good methods will live on granted they have value. What I’m hugely tickled by is that the library is really developed with inspiration from R! You can even read about fitting models using R-style formulas. What’s really neat is that this library could be a nice entrypoint for a traditionally R-using statistician to give Python a try. Akin to other stats libraries that it’s likely inspired by, it also provides a datasets package for tutorials and examples.
How do I cite it?
You can cite statsmodels as follows, a pdf of the paper is available here:
@inproceedings{seabold2010statsmodels,
  title={statsmodels: Econometric and statistical modeling with python},
  author={Seabold, Skipper and Perktold, Josef},
  booktitle={9th Python in Science Conference},
  year={2010},
}
And view more details here.
How do I get started?
- statsmodels Documentation is always a good place to start.
- Developers Page provides information about contributing.
How do I contribute to the software survey?
or read more about annotation here. You can clone the software repository to do bulk annotation, or annotation any repository in the software database, We want annotation to be fun, straight-forward, and easy, so we will be showcasing one repository to annotate per week. If you’d like to request annotation of a particular repository (or addition to the software database) please don’t hesitate to open an issue or even a pull request.
Where can I learn more?
You might find these other resources useful:
- The Research Software Database on GitHub
- RSEpedia Documentation
- Google Docs Manuscript you are invited to contribute to.
- Annotation Documentation for RSEpedia
- Annotation Tutorial in RSEng docs
For any resource, you are encouraged to give feedback and contribute!
Recent Posts
- Posted on 21 Mar 2021
- Posted on 07 Mar 2021
- Posted on 21 Feb 2021
- Posted on 21 Feb 2021