Ideogram.js
Visualization is a powerful tool to understand and explore data, but it’s often overlooked. In scientific visualization, the best libraries can allow a scientist to bring life to something that we otherwise might not be able to see. Thus, for the software showcase this week, we are proud to share Ideogram.js, a visualization library in JavaScript that can draw and animate genome-wide datasets.

If you are familiar with the RSEPedia or software, we encourage you to contribute to the research software encyclopedia and annotate the respository:
otherwise, keep reading!
- What is Ideogram.js
- How do I cite it?
- How do I contribute to the software survey
- Where can I learn more?
What is Ideogram.js
We obviously can’t see chromosomes. But being able to visualize them, and understand context (location, possibly an expression value) could be a useful thing for a scientist to do. But let’s ask the lead developer directly! This is from the project README:
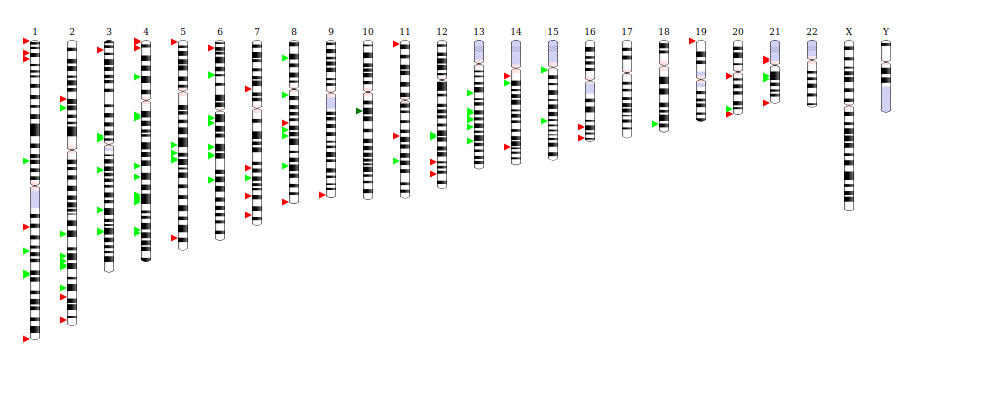
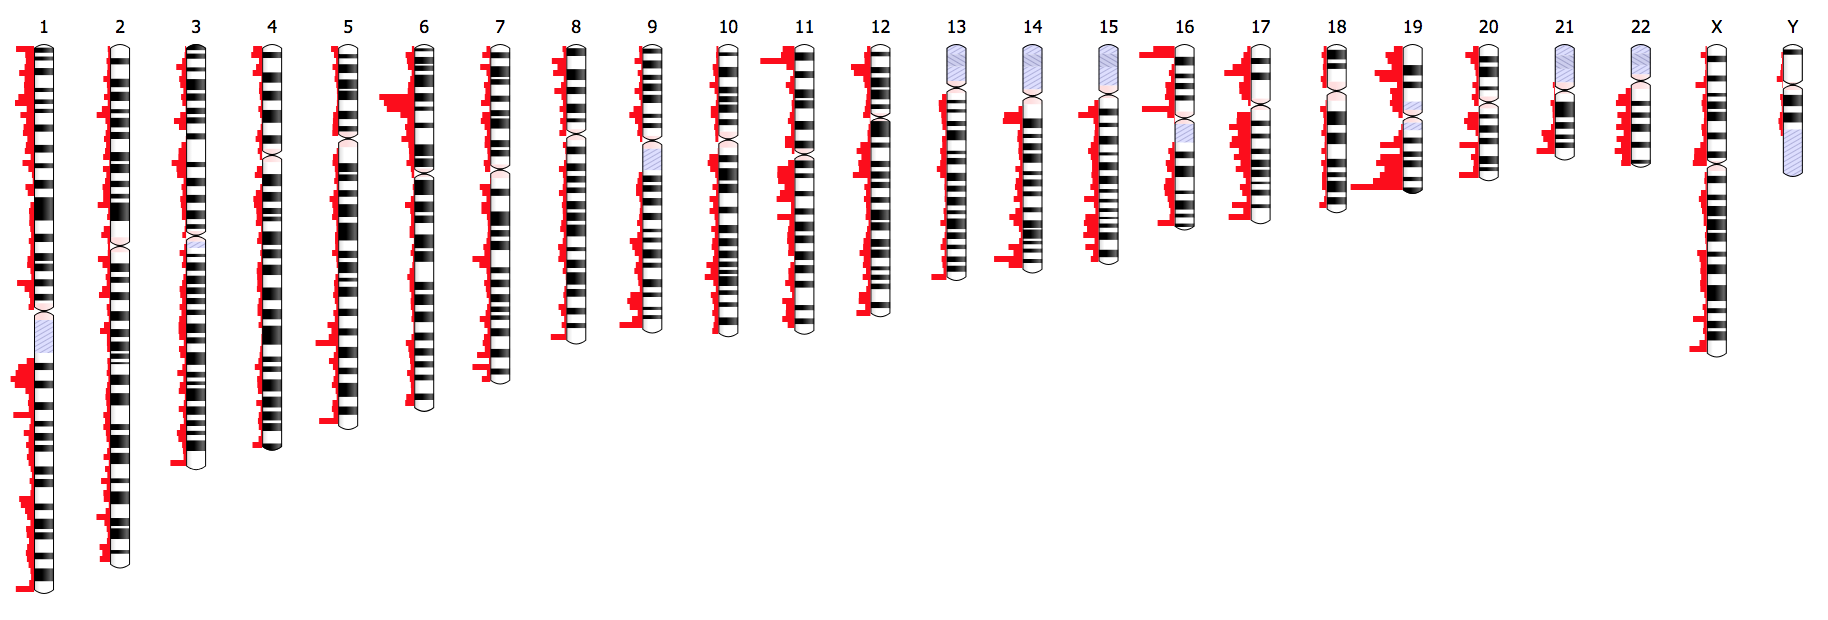
Ideogram supports drawing and animating genome-wide datasets for human, mouse, and many other eukaryotes. The Ideogram API for annotations supports histograms, heatmaps, overlays, and points of arbitrary shape and color layered in tracks. Ideogram can depict haploid, diploid or higher ploidy genomes (e.g. plants), as well as aneuploidy, genetic recombination, and homologous features between chromosomes.
Ideogram can be embedded as a reusable component in any web page or application, and leverages D3.js and SVG to achieve fast, crisp client-side rendering. You can also integrate Ideogram with JavaScript frameworks like Angular, React, and Vue, as well as data science platforms like R and Jupyter Notebook.
The lead developer, Eric Weitz, started working on Ideogram.js in February 2015, and has developed it as a personal side project on nights and weekends almost daily since.
Why is it useful?
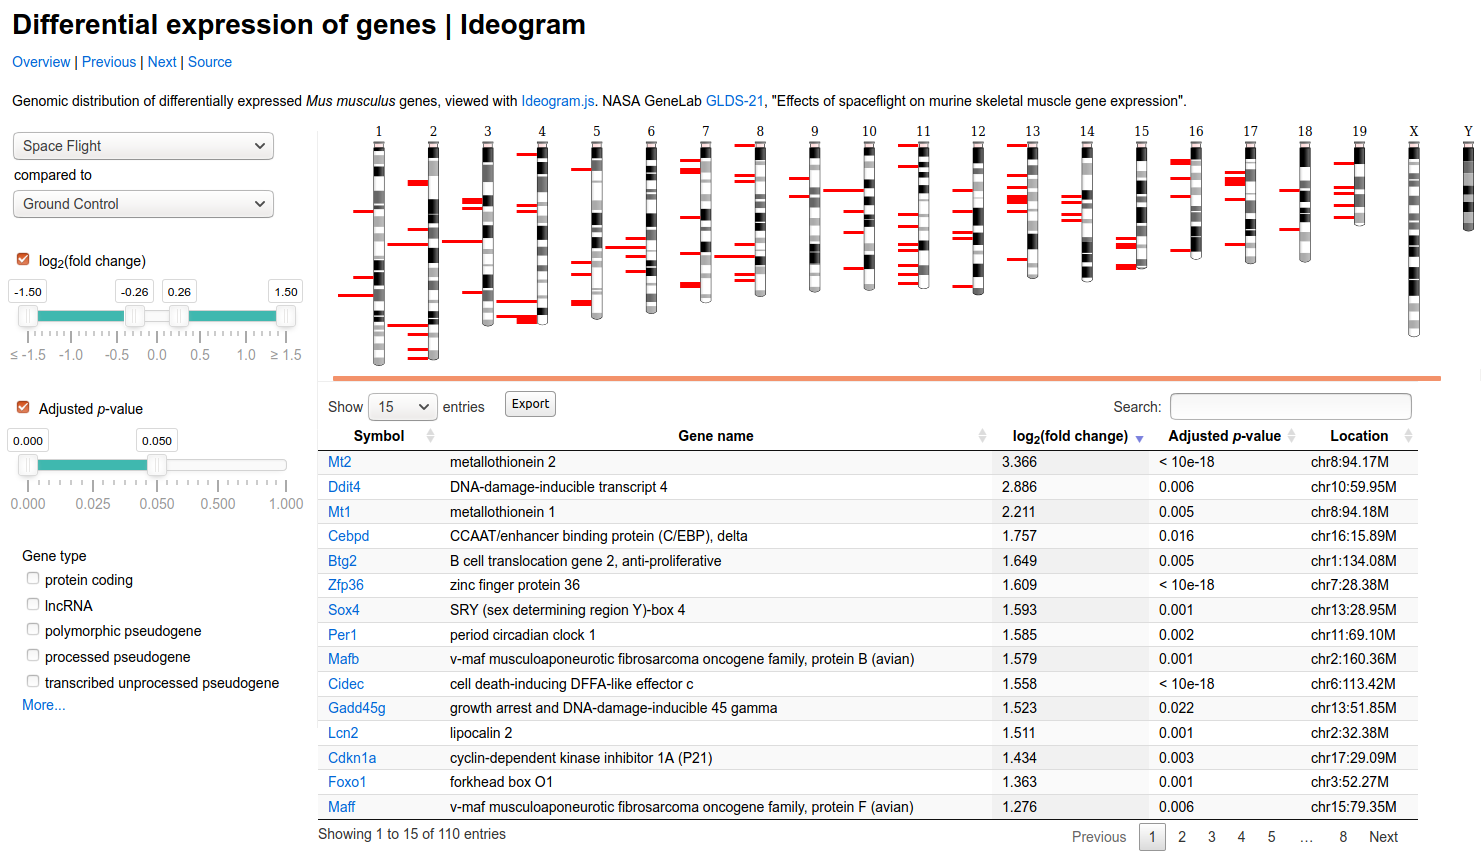
As a developer, it’s very appealing to have a base or core library that I’m empowered to use to create custom dashboards or interfaces. Here is an example of that provided on the site showing differential expression:

You can also take a look at live examples, or see the project on GitHub for installation, usage, and the API.
How do I cite it?
The lead developer recommends the following two citations. The first is not bibtex, but a general reference to the repository:
Weitz, Eric M. Ideogram.js. 2015. https://github.com/eweitz/ideogram.
the second is related work that uses Ideogram.js.
@Article{ 10.12688/f1000research.9762.1,
AUTHOR = { Weitz, EM and Pantano, L and Zhu, J and Upton, B and Busby, B},
TITLE = {Viewing RNA-seq data on the entire human genome [version 1; peer review: 3 approved]
},
JOURNAL = {F1000Research},
VOLUME = {6},
YEAR = {2017},
NUMBER = {596},
DOI = {10.12688/f1000research.9762.1}
}
You can view the paper here.
How do I get started?
- Ideogram.js Documentation served via GitHub pages on the site.
- Ideogram.js Slides “Visualizations with Ideogram.js”
- Ideogram.js on GitHub
- Ideogram.js: Chromosome visualization with JavaScript October 2018
- Designing genome visualizations with Ideogram.js, April 2020
How do I contribute to the software survey?
or read more about annotation here. You can clone the software repository to do bulk annotation, or annotation any repository in the software database, We want annotation to be fun, straight-forward, and easy, so we will be showcasing one repository to annotate per week. If you’d like to request annotation of a particular repository (or addition to the software database) please don’t hesitate to open an issue or even a pull request.
Where can I learn more?
You might find these other resources useful:
- The Research Software Database on GitHub
- RSEpedia Documentation
- Google Docs Manuscript you are invited to contribute to.
- Annotation Documentation for RSEpedia
- Annotation Tutorial in RSEng docs
For any resource, you are encouraged to give feedback and contribute!
Recent Posts
- Posted on 21 Mar 2021
- Posted on 07 Mar 2021
- Posted on 21 Feb 2021
- Posted on 21 Feb 2021
